What Are Heikin Ashi Candles?
Identify Trends More Clearly
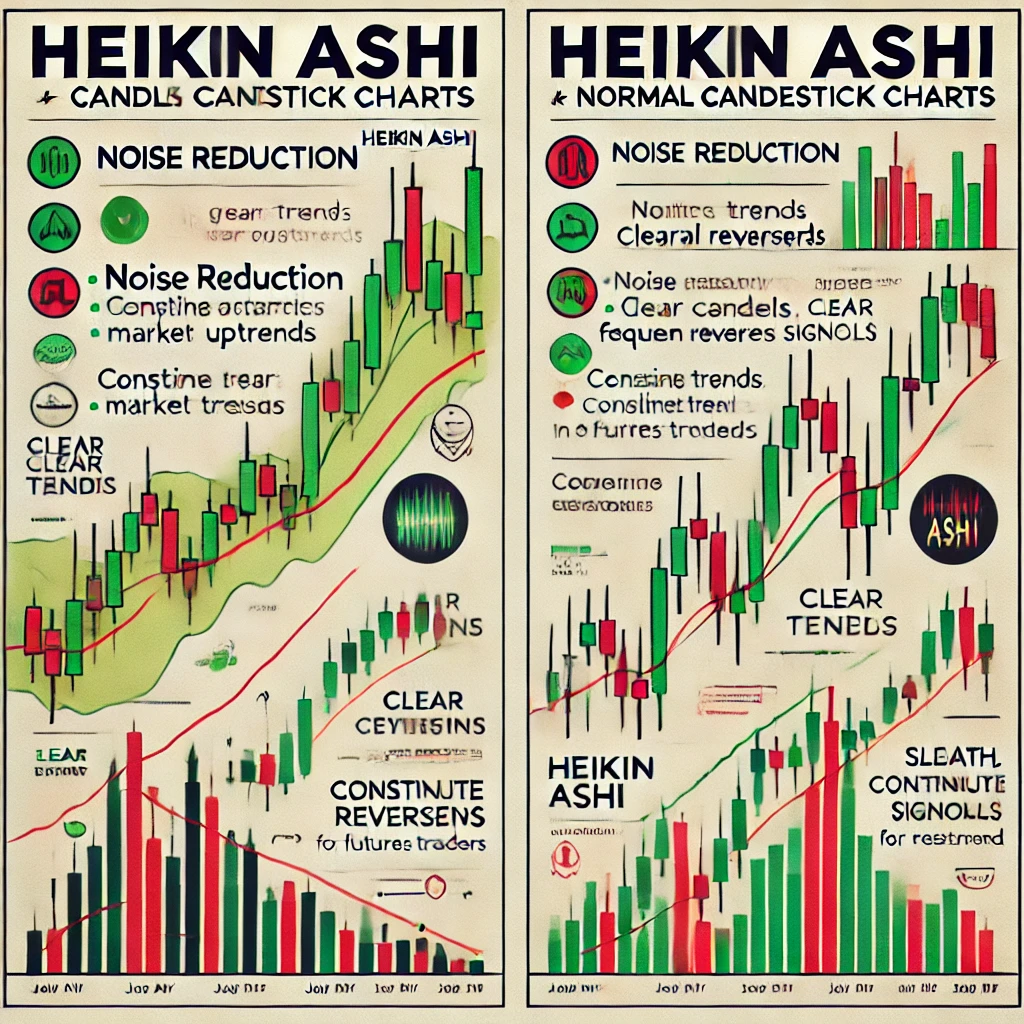
Heikin Ashi (Japanese for “average bar”) is a charting technique that uses modified open, high, low, and close prices to create smoother, more easily interpretable candlestick charts. Unlike traditional candlesticks, which represent raw price data, Heikin Ashi candles are derived from averages, helping traders identify trends more clearly.
Visual Illustration

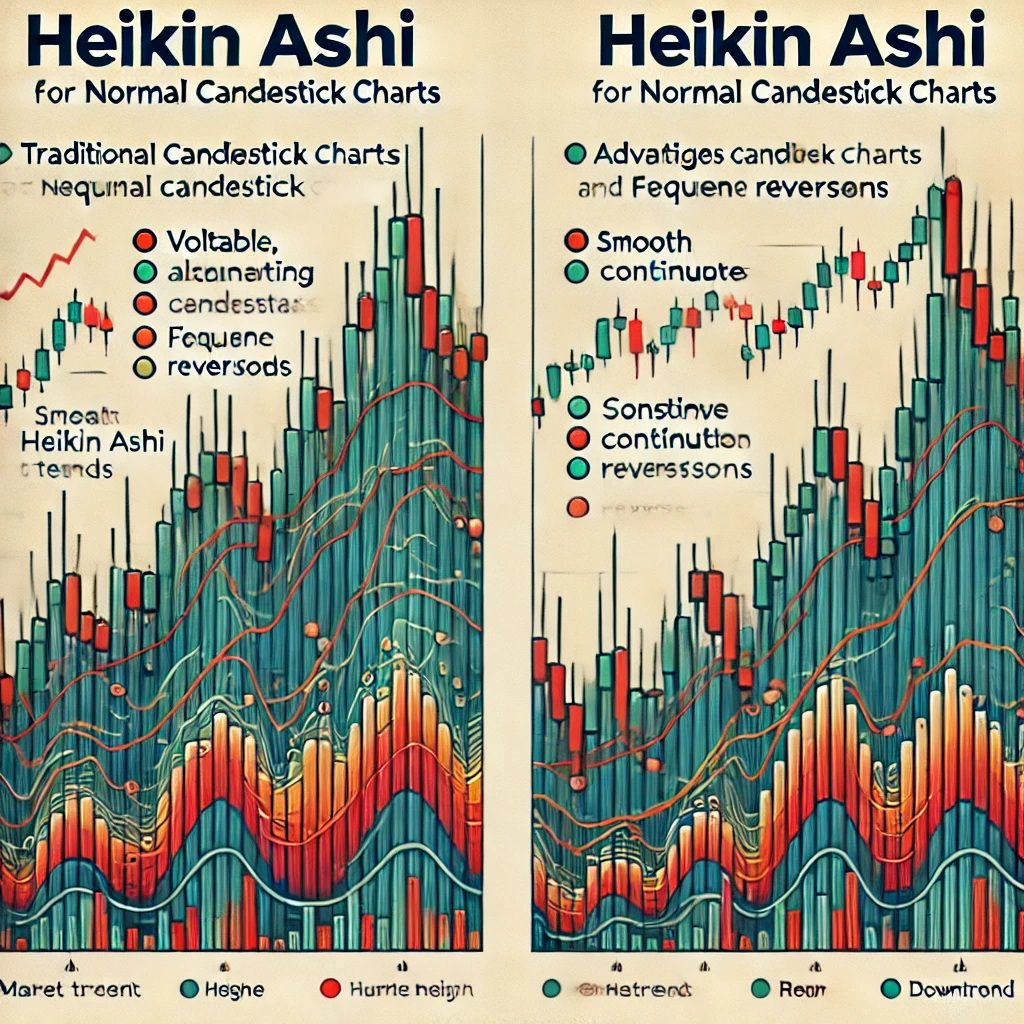
Here is a visual comparison between Heikin Ashi and traditional candlestick charts. The image illustrates the smoother trends in Heikin Ashi candles compared to the noisy fluctuations of traditional candles, highlighting their advantage for futures trading analysis. Let me know if you’d like additional details or modifications!
Comparison Chart
| Chart Type | Illustration |
|---|---|
| Normal Candlestick | Shows frequent alternation between green and red candles, with no clear trend. |
| Heikin Ashi Candlestick | Displays smooth, uninterrupted trends, making it easier to identify uptrends, downtrends, and consolidations. |
Key Differences Between Heikin Ashi
and Normal Candles
| Feature | Normal Candles | Heikin Ashi Candles |
|---|
| Data Representation | Raw open, high, low, and close prices for each bar. | Calculated values to smooth out noise. |
| Visual Appearance | Highly volatile; frequent color changes. | Smoother trends with fewer color reversals. |
| Use Case | Precise price levels; short-term trading. | Identifying trends and reducing market noise. |
Heikin Ashi Calculation
Heikin Ashi candles are calculated as follows:
- Open =
(Previous Heikin Ashi Candle Open + Previous Heikin Ashi Candle Close) / 2 - Close =
(Open + High + Low + Close) / 4 - High =
Maximum of High, Heikin Ashi Open, and Heikin Ashi Close - Low =
Minimum of Low, Heikin Ashi Open, and Heikin Ashi Close
Why Heikin Ashi Candles Are Better for Futures Trading
Trend Identification
- Heikin Ashi Advantage: Smooth trends make it easier to see when a market is in an uptrend or downtrend. Bullish candles are consistently green, and bearish candles are red, with minimal color noise.
- Benefit for Futures Traders: Clear trends reduce false signals and allow traders to hold positions longer during strong moves.
2. Noise Reduction
- Heikin Ashi Advantage: Removes much of the intra-day volatility and noise from the chart.
- Benefit for Futures Traders: Futures markets often have rapid price fluctuations. Heikin Ashi filters out this noise, making the bigger picture clearer.
3. Reversal Signals
- Heikin Ashi Advantage: Smaller candles or doji-like candles often appear at trend reversals.
- Benefit for Futures Traders: Spotting reversals is critical for profit-taking or entering a new position.
4. Simpler Decision-Making
Benefit for Futures Traders: Simplifies technical analysis and prevents decision paralysis.
Heikin Ashi Advantage: Consistent candle coloring helps traders avoid over analyzing individual candles.
Possible Pitfals of using Heikin Ashi Candles
While Heikin Ashi (HA) candles offer advantages like smoother trends and noise reduction, they also have limitations and potential pitfalls compared to traditional candlesticks.
While Heikin Ashi (HA) candles offer advantages like smoother trends and noise reduction, they also have limitations and potential pitfalls compared to traditional candlesticks.

Here are the key drawbacks:
1. Delayed Signals
- Why it happens: Heikin Ashi candles use averaged data, which lags behind real-time price movements.
- Implications:
- Entry and exit points might occur later than they would with normal candlesticks.
- In fast-moving markets, this delay can result in missed opportunities or increased risk.
- Example: A reversal might already have occurred in the market, but the HA chart still shows the previous trend.
2. Inaccurate Price Representation
- Why it happens: Heikin Ashi does not reflect actual open, high, low, and close prices of the market.
- Implications:
- Traders lose the ability to see exact price levels.
- Stop-loss and profit-taking decisions based on real-time price may become challenging.
- Example: A trader setting a stop-loss based on HA lows may miss important real price action levels visible on a normal candlestick chart.
3. Difficulty in Spotting Gaps
- Why it happens: The averaging formula smooths out gaps in price action.
- Implications:
- Gaps, which are often critical for technical analysis, become invisible or less pronounced.
- Gap trading strategies cannot be effectively executed using HA charts.
4. Limited Use for Short-Term Trading
- Why it happens: The lagging nature and smoothed appearance of HA candles make them less effective for scalping or very short-term trading.
- Implications:
- Scalpers may miss quick reversals and critical price levels.
- HA candles are better suited for swing trading or identifying larger trends.
- Example: Day traders may find traditional candlesticks more responsive to intraday volatility.
5. False Trend Continuation
- Why it happens: HA candles tend to show continuous trends even when the market is ranging or reversing.
- Implications:
- It can mislead traders into staying in positions longer than they should.
- Ranging markets might appear as weak trends, leading to incorrect decisions.
- Example: A ranging market could appear as a mild uptrend, causing traders to buy inappropriately.
6. Lack of Specific Patterns
- Why it happens: Heikin Ashi averages out price data, which reduces the visibility of classic candlestick patterns like dojis, hammers, or engulfing patterns.
- Implications:
- Traders relying on candlestick patterns for decision-making lose valuable information.
- Strategies based on patterns like Morning Star or Shooting Star cannot be applied.
- Example: A doji, which signals indecision or a reversal, might not be visible on a HA chart.
7. Not Ideal for Precise Risk Management
- Why it happens: The HA calculation can distort the actual price range.
- Implications:
- Stop-loss and target placement becomes less precise.
- Risk/reward calculations can become skewed.
- Example: A trader placing a stop-loss based on the HA candle low might use a wider or narrower stop than necessary.
8. Requires Confirmation with Other Tools
- Why it happens: HA candles are not standalone indicators and often need additional analysis for confirmation.
- Implications:
- Traders must rely on oscillators, moving averages, or traditional candlesticks to validate signals.
- Over-reliance on HA charts without confirmation can lead to poor decision-making.
- Example: A bullish HA trend may still reverse unexpectedly if momentum indicators show divergence.
9. Challenges in Automated Trading
- Why it happens: Many algorithms and automated systems are designed for traditional candlesticks.
- Implications:
- Custom programming may be required to integrate HA candles into automated systems.
- Traders using automated strategies might find HA implementation more complex.
10. Overlooks Microstructure and Volume
- Why it happens: HA focuses purely on price smoothing, often ignoring market microstructure and volume analysis.
- Implications:
- Traders miss key insights from volume spikes or microstructure that are visible with normal candles.
- Volume-based strategies like volume profile analysis may become less effective.
When to Use Heikin Ashi and When to Avoid
Use HA Candles If:
- You’re swing trading or focusing on longer-term trends.
- You want to reduce noise in highly volatile markets.
- Your strategy prioritizes trend-following over exact price points.
Avoid HA Candles If:
- You’re scalping or trading very short timeframes.
- You rely on precise price levels for stop-loss or target placement.
- Your strategy depends on candlestick patterns or gap analysis.
Mitigating Pitfalls
- Combine Charts: Use Heikin Ashi for trend analysis and normal candlesticks for precise entries and exits.
- Use Indicators: Pair HA candles with indicators like RSI, MACD, or volume for better confirmation.
- Set Alerts: Use price-based alerts to compensate for HA’s lagging nature.
Here are the key drawbacks:
1. Delayed Signals
- Why it happens: Heikin Ashi candles use averaged data, which lags behind real-time price movements.
- Implications:
- Entry and exit points might occur later than they would with normal candlesticks.
- In fast-moving markets, this delay can result in missed opportunities or increased risk.
- Example: A reversal might already have occurred in the market, but the HA chart still shows the previous trend.
2. Inaccurate Price Representation
- Why it happens: Heikin Ashi does not reflect actual open, high, low, and close prices of the market.
- Implications:
- Traders lose the ability to see exact price levels.
- Stop-loss and profit-taking decisions based on real-time price may become challenging.
- Example: A trader setting a stop-loss based on HA lows may miss important real price action levels visible on a normal candlestick chart.
3. Difficulty in Spotting Gaps
- Why it happens: The averaging formula smooths out gaps in price action.
- Implications:
- Gaps, which are often critical for technical analysis, become invisible or less pronounced.
- Gap trading strategies cannot be effectively executed using HA charts.
4. Limited Use for Short-Term Trading
- Why it happens: The lagging nature and smoothed appearance of HA candles make them less effective for scalping or very short-term trading.
- Implications:
- Scalpers may miss quick reversals and critical price levels.
- HA candles are better suited for swing trading or identifying larger trends.
- Example: Day traders may find traditional candlesticks more responsive to intraday volatility.
5. False Trend Continuation
- Why it happens: HA candles tend to show continuous trends even when the market is ranging or reversing.
- Implications:
- It can mislead traders into staying in positions longer than they should.
- Ranging markets might appear as weak trends, leading to incorrect decisions.
- Example: A ranging market could appear as a mild uptrend, causing traders to buy inappropriately.
6. Lack of Specific Patterns
- Why it happens: Heikin Ashi averages out price data, which reduces the visibility of classic candlestick patterns like dojis, hammers, or engulfing patterns.
- Implications:
- Traders relying on candlestick patterns for decision-making lose valuable information.
- Strategies based on patterns like Morning Star or Shooting Star cannot be applied.
- Example: A doji, which signals indecision or a reversal, might not be visible on a HA chart.
7. Not Ideal for Precise Risk Management
- Why it happens: The HA calculation can distort the actual price range.
- Implications:
- Stop-loss and target placement becomes less precise.
- Risk/reward calculations can become skewed.
- Example: A trader placing a stop-loss based on the HA candle low might use a wider or narrower stop than necessary.
8. Requires Confirmation with Other Tools
- Why it happens: HA candles are not standalone indicators and often need additional analysis for confirmation.
- Implications:
- Traders must rely on oscillators, moving averages, or traditional candlesticks to validate signals.
- Over-reliance on HA charts without confirmation can lead to poor decision-making.
- Example: A bullish HA trend may still reverse unexpectedly if momentum indicators show divergence.
9. Challenges in Automated Trading
- Why it happens: Many algorithms and automated systems are designed for traditional candlesticks.
- Implications:
- Custom programming may be required to integrate HA candles into automated systems.
- Traders using automated strategies might find HA implementation more complex.
10. Overlooks Microstructure and Volume
- Why it happens: HA focuses purely on price smoothing, often ignoring market microstructure and volume analysis.
- Implications:
- Traders miss key insights from volume spikes or microstructure that are visible with normal candles.
- Volume-based strategies like volume profile analysis may become less effective.
When to Use Heikin Ashi and When to Avoid
Use HA Candles If:
- You’re swing trading or focusing on longer-term trends.
- You want to reduce noise in highly volatile markets.
- Your strategy prioritizes trend-following over exact price points.
Avoid HA Candles If:
- You’re scalping or trading very short timeframes.
- You rely on precise price levels for stop-loss or target placement.
- Your strategy depends on candlestick patterns or gap analysis.
While Heikin Ashi (HA) candles offer advantages like smoother trends and noise reduction, they also have limitations and potential pitfalls compared to traditional candlesticks. Here are the key drawbacks:
1. Delayed Signals
- Why it happens: Heikin Ashi candles use averaged data, which lags behind real-time price movements.
- Implications:
- Entry and exit points might occur later than they would with normal candlesticks.
- In fast-moving markets, this delay can result in missed opportunities or increased risk.
- Example: A reversal might already have occurred in the market, but the HA chart still shows the previous trend.
2. Inaccurate Price Representation
- Why it happens: Heikin Ashi does not reflect actual open, high, low, and close prices of the market.
- Implications:
- Traders lose the ability to see exact price levels.
- Stop-loss and profit-taking decisions based on real-time price may become challenging.
- Example: A trader setting a stop-loss based on HA lows may miss important real price action levels visible on a normal candlestick chart.
3. Difficulty in Spotting Gaps
- Why it happens: The averaging formula smooths out gaps in price action.
- Implications:
- Gaps, which are often critical for technical analysis, become invisible or less pronounced.
- Gap trading strategies cannot be effectively executed using HA charts.
4. Limited Use for Short-Term Trading
- Why it happens: The lagging nature and smoothed appearance of HA candles make them less effective for scalping or very short-term trading.
- Implications:
- Scalpers may miss quick reversals and critical price levels.
- HA candles are better suited for swing trading or identifying larger trends.
- Example: Day traders may find traditional candlesticks more responsive to intraday volatility.
5. False Trend Continuation
- Why it happens: HA candles tend to show continuous trends even when the market is ranging or reversing.
- Implications:
- It can mislead traders into staying in positions longer than they should.
- Ranging markets might appear as weak trends, leading to incorrect decisions.
- Example: A ranging market could appear as a mild uptrend, causing traders to buy inappropriately.
6. Lack of Specific Patterns
- Why it happens: Heikin Ashi averages out price data, which reduces the visibility of classic candlestick patterns like dojis, hammers, or engulfing patterns.
- Implications:
- Traders relying on candlestick patterns for decision-making lose valuable information.
- Strategies based on patterns like Morning Star or Shooting Star cannot be applied.
- Example: A doji, which signals indecision or a reversal, might not be visible on a HA chart.
7. Not Ideal for Precise Risk Management
- Why it happens: The HA calculation can distort the actual price range.
- Implications:
- Stop-loss and target placement becomes less precise.
- Risk/reward calculations can become skewed.
- Example: A trader placing a stop-loss based on the HA candle low might use a wider or narrower stop than necessary.
8. Requires Confirmation with Other Tools
- Why it happens: HA candles are not standalone indicators and often need additional analysis for confirmation.
- Implications:
- Traders must rely on oscillators, moving averages, or traditional candlesticks to validate signals.
- Over-reliance on HA charts without confirmation can lead to poor decision-making.
- Example: A bullish HA trend may still reverse unexpectedly if momentum indicators show divergence.
9. Challenges in Automated Trading
- Why it happens: Many algorithms and automated systems are designed for traditional candlesticks.
- Implications:
- Custom programming may be required to integrate HA candles into automated systems.
- Traders using automated strategies might find HA implementation more complex.
10. Overlooks Microstructure and Volume
- Why it happens: HA focuses purely on price smoothing, often ignoring market microstructure and volume analysis.
- Implications:
- Traders miss key insights from volume spikes or microstructure that are visible with normal candles.
- Volume-based strategies like volume profile analysis may become less effective.
When to Use Heikin Ashi and When to Avoid
Use HA Candles If:
- You’re swing trading or focusing on longer-term trends.
- You want to reduce noise in highly volatile markets.
- Your strategy prioritizes trend-following over exact price points.
Avoid HA Candles If:
- You’re scalping or trading very short timeframes.
- You rely on precise price levels for stop-loss or target placement.
- Your strategy depends on candlestick patterns or gap analysis.
Mitigating Pitfalls
- Combine Charts: Use Heikin Ashi for trend analysis and normal candlesticks for precise entries and exits.
- Use Indicators: Pair HA candles with indicators like RSI, MACD, or volume for better confirmation.
- Set Alerts: Use price-based alerts to compensate for HA’s lagging nature.
By understanding these limitations and combining Heikin Ashi with other tools, you can leverage its strengths while avoiding potential pitfalls. Let me know if you’d like further clarification or assistance!

See Our Tools
Professional level tools for the Retail Trader. Trading Tools designed by professional traders

